Applies to
ApexSQL Monitor
Symptoms
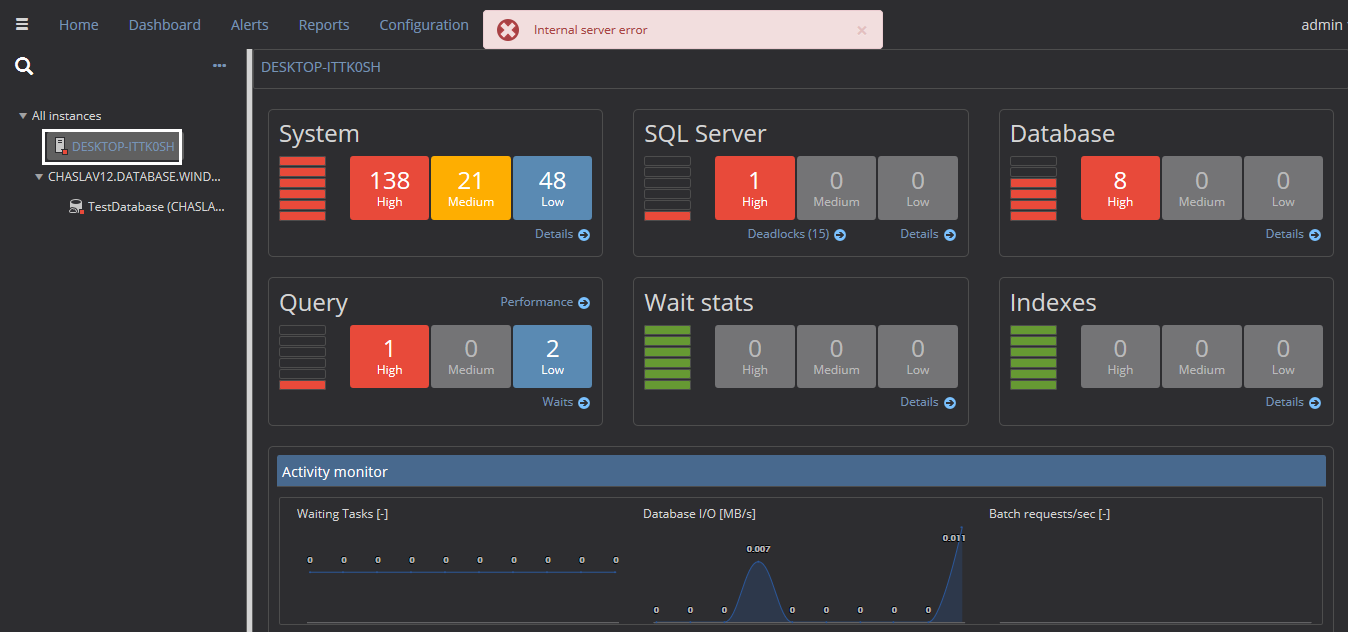
The Internal server error warning message appears in the Dashboard page when in the instance tree view a particular SQL Server is selected.
Problem
The Internal server error warning message appears for a particular server, not for all monitored servers.
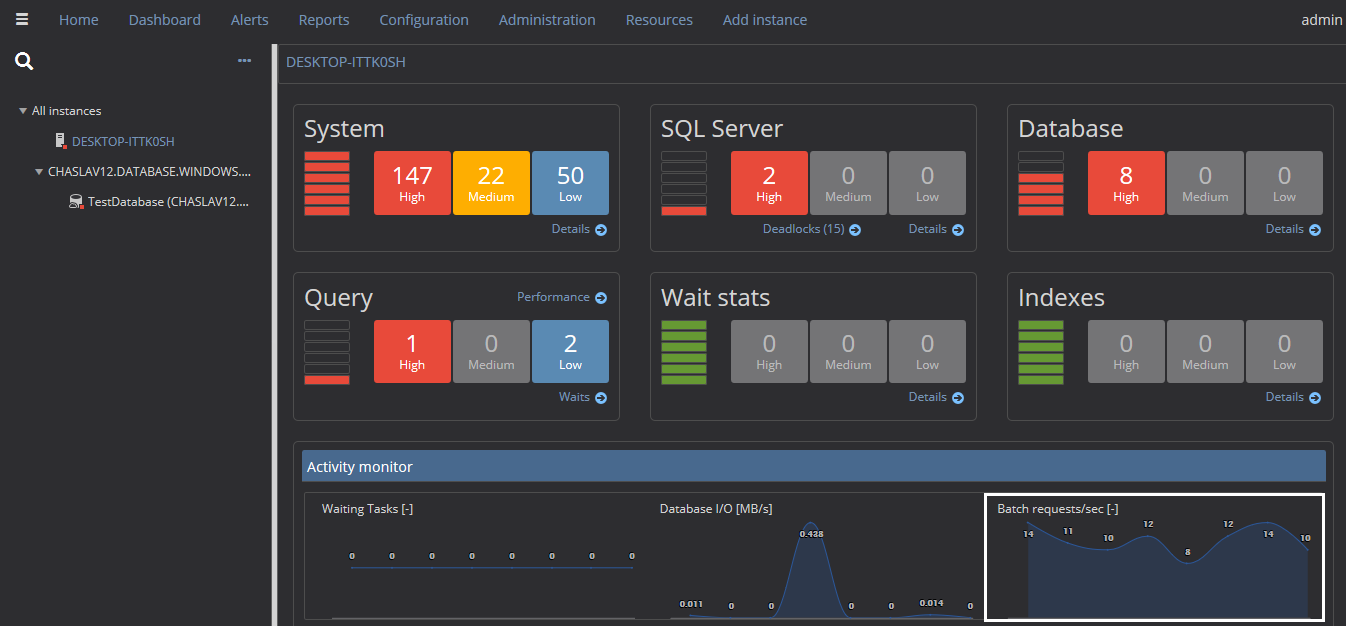
In the tree view, select a SQL Server instance and press the Dashboard tab, the Dashboard page for a selected SQL Server instance will appear. Immediately after showing the Dashboard page, the Internal server error warning message will appear:
Cause
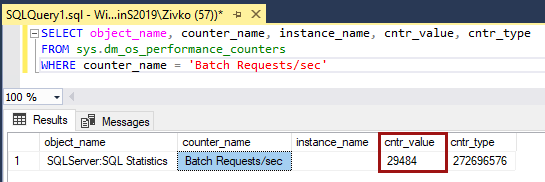
This happens because of missing the Batch Requests/sec performance counter values under the sys.dm_os_performance_counters table
SELECT object_name
	,counter_name
	,instance_name
	,cntr_value
	,cntr_type
FROM sys.dm_os_performance_counters
WHERE counter_name = 'Batch Requests/sec'
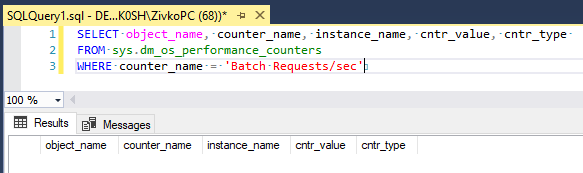
These values ApexSQL Monitor uses for the Batch requests/sec [-] chart under the Activity monitor section:
Resolution
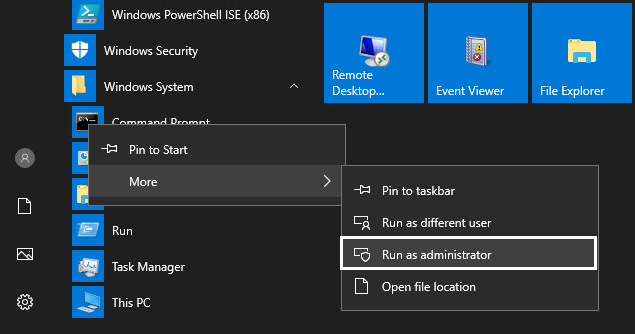
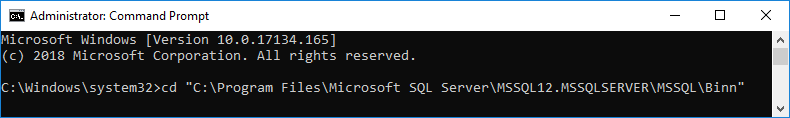
Open the Command Prompt console as an administrator:
In the Command Prompt console, navigate to the Binn folder of a problematical SQL Server instance. For example: C:\Program Files\Microsoft SQL Server\MSSQL12.MSSQLSERVER\MSSQL\Binn)
Paste and execute the following command: unlodctr MSSQLSERVER
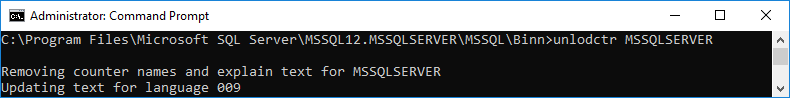
This will remove any leftovers of the SQL counters. The unlodctr MSSQLSERVER command is for cleaning SQL counters for default instance, for named instance, use this format: MSSQL$InstanceName
For example, unlodctr MSSQL$ZIVKOSERVER
To load counters, use the following command: lodctr perf-MSSQLSERVERsqlctr.ini
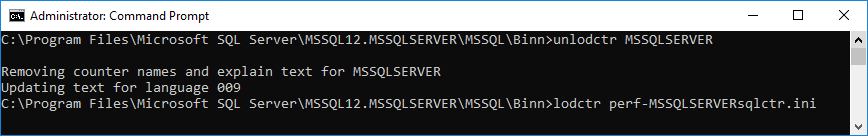
For the named instance, use the following format: perf- MSSQL$InstanceNamesqlctr.ini
For example, lodctr perf-MSSQL$ZIVKOSERVERsqlctr.ini
Now, execute a couple of more commands in the Command Prompt console to restart Remote Registry and Performance Logs & Alerts service:
net stop “Remote Registry” && net start “Remote Registry”
net stop “Performance Logs & Alerts” && net start ” Performance Logs & Alerts “
More about SQL performance counters can be found on the SQL Performance Counters are Missing page
If that doesn’t work, you can choose underway to back the SQL performance counters.
In the SQL Server Configuration Manager dialog, select a SQL Server instance that has a problem with performance counters:
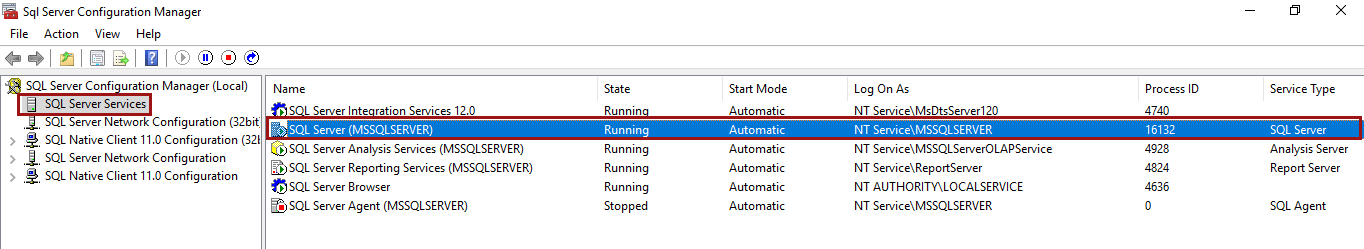
Right click, and choose the Properties command. Under the Log on cart, click the Built-in account radio button and from the drop-down box, choose the Local System account:
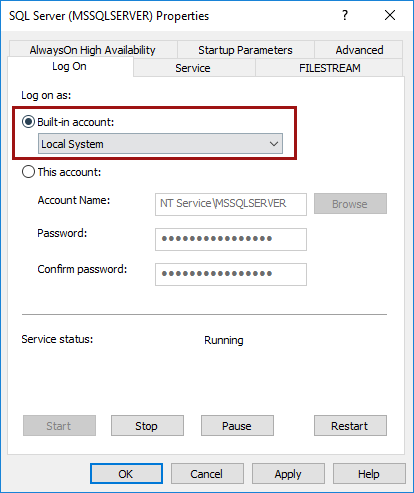
Click the Apply button and restart the SQL Server instance.
After that, the values under the cntr_value column of the sys.dm_os_performance_counters table should appear:
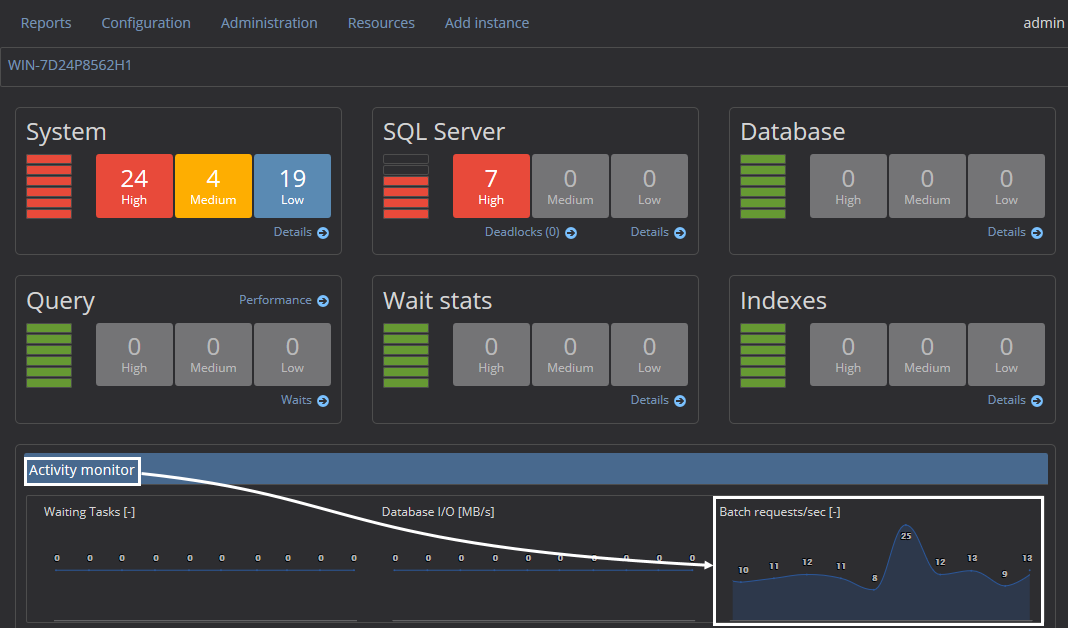
Now, when go to ApexSQL Monitor page and select a problematical server, the internal server error message should not appear and the chart for the Bach requests under the Activity monitor section should appear:
The third way to back the SQL performance counters is to use the latest cumulative update for SQL Server where the issue with SQL performance counters is fixed.
The reason for losing your SQL performance counters can be different:
- Performance Counters are missing after the installation of SSAS 2017 in tabular mode
- “SQL Server performance counters are disabled” when you move the SQL Server resource in SQL Server 2014